The summit finishes of the Giro
As noted in my last entry, this year’s Giro d’Italia offers no less than 7 stages ending with substantial climbs. Summit finishes are great as they offer a unique opportunity to glimpse into the capabilities of the overall contenders, as if you’re contending, you pretty much have to go full gas uphill!
In today’s entry, I’ll introduce the summit finishes as well as show data from actual riders with power meters (and their associated masses) for these climbs. I also provide the equations for each climb to determine a riders average power-to-mass ratio for a climb given their time to finish, and vice-versa, this way we can analyze a rider’s performance after each of these climbs is completed.
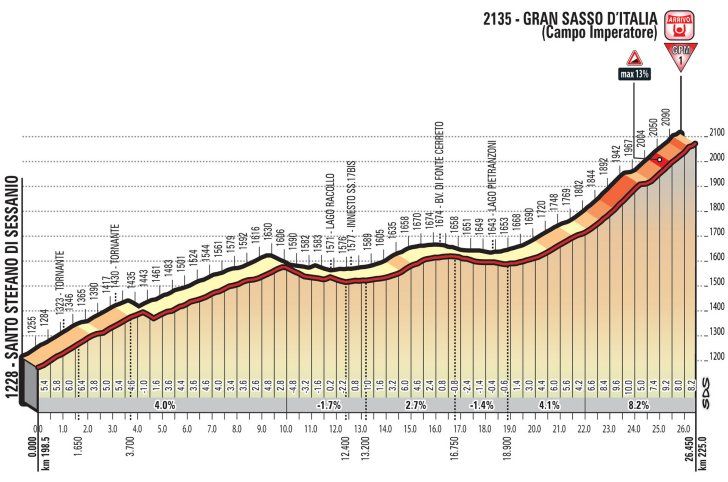
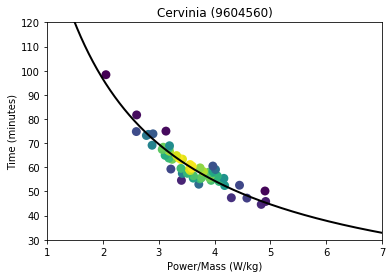
As noted in my last entry, the requisite equation between these power-to-mass and time is given by time = A/(<power>/mass-B), where time is given in seconds, <power> denotes average power over the climb in Watts, and mass is the mass of the rider in kilograms. A and B are coefficients determined from Strava data for each climb, only from riders who have used a power meter and their associated mass. Note that the model implicitly takes into equipment mass, so the mass here is strictly the mass of the rider.
This equation can also be inverted to give <power>/mass = A/time+B, which is probably of more interest given that we’ll know or can infer climbing times for riders.
| stage | climb | A | B |
|---|---|---|---|
| 6 | Etna | n/a | n/a |
| 8 | Montevergine | (14047) | (-1.1574) |
| 9 | Campo Imperatore | (9034.7) | (-1.3181) |
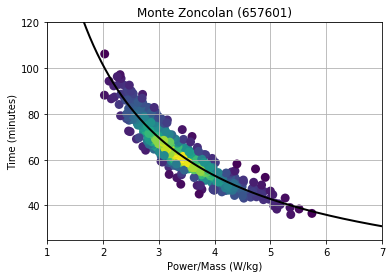
| 14 | Monte Zoncolan | (14539) | (-0.5088) |
| 18 | Prato Nevoso | (12117) | (-0.4951) |
| 19 | Monte Jafferau | (10069) | (-1.1169) |
| 20 | Cervinia | (14977) | (-0.5875) |
As an example of how this works in practice, let’s say Tom Dumoulin completes Zoncolan in a time of 38:30, which equates to 2,310 seconds. Using the coefficients above, his estimated <power>/mass for the climb would be 14977/2310 + (-0.5875) = 5.896 W/kg. At an estimated race weight of 71 kg, we could estimate his power about to be 419 W over that 38:30. This applies for any rider of any mass, if we know their time on the climb.
Some folks have asked if I’ll do predictions before the climbs, which is a bit tough since I don’t know power profiles for riders ahead of time. On the other hand, having a tool like this will be great to establish rather firmly what the power profiles for riders actually are, and will lead to more robust predictions in future races!
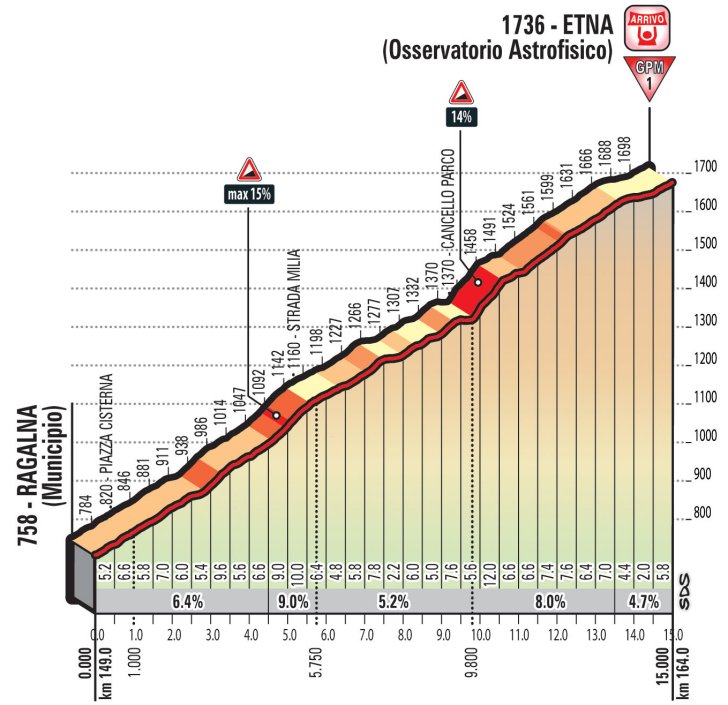
Stage 6: Etna
Strava segment: 19.2 km, 7% average gradient, 1,254 m elevation gain
The Giro this years ascends Etna from the South, instead of the more popular route from the East, thus making it difficult to provide much of an analysis since currently there are only 7 riders who have completed this segment! Still, the climb looks intimidating, as it’s a roughly 12 mile slog up an average gradient of 7%. My guess is that this will slightly favor the climbers, particularly the ramp of 14% at roughly 5km to go, which we might see a few attacks. The climb gets ever so slightly at the top, so expect a group finish if there’s not much fireworks on the lower-to-mid slops.
Stage 8: Montevergine
Strava segment: 14.8 km, 5% average gradient, 762 m elevation gain
At an average and fairly consistent gradient of 5%, except the Montevergine to end in a bunch finish. A few contenders may slip due to tired legs, but the easier gradient allows for aerodynamics to come more into play, making it easier for the bigger, raw power guys to stay in contention.


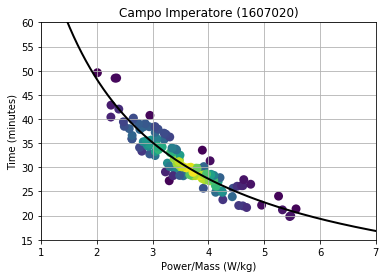
Stage 9: Campo Imperatore
Strava segment: 7.7 km, 6% average gradient, 478 m elevation gain
Stage 9 has a long final ascent, though only the last 7.7 km is really enough to consider a summit finish. At 6%, it’s also somewhat of a power climb, thus the bigger guys won’t have too much problem keeping up. Still, look for tired legs to see a favorite or two lose some time.
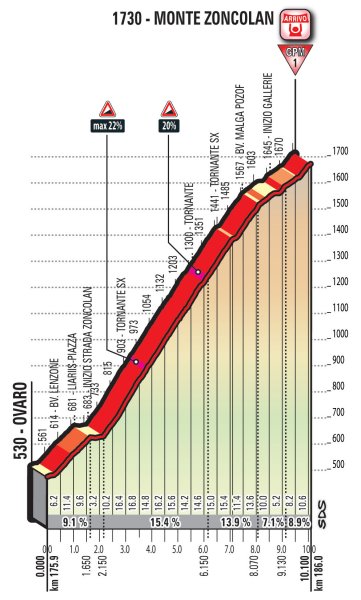
Stage 14: Monte Zoncolan
Strava segment: 7.5 km, 13% average gradient, 1,018 m elevation gain
This is the climb that will make or break the Giro for the favorites. The pure climbers (e.g. Yates, Pinot, Pozzovivo) will be looking to gain as much time as possible to make up for losses in the time trials, whereas the power guys like Dumoulin and Dennis will look to limit damage. While only 7.5 km long, it’s a absolutely punishing 13%, and for those of you who haven’t witness a prolonged gradient like this, it’s absolute hell. Attacks will fly, and they’ll fly early.
Stage 18: Prato Nevoso
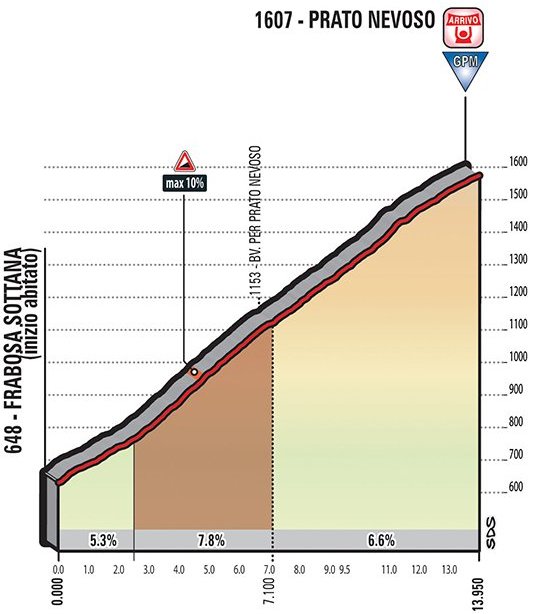
Strava segment: 10.6 km, 8% average gradient, 805 m elevation gain
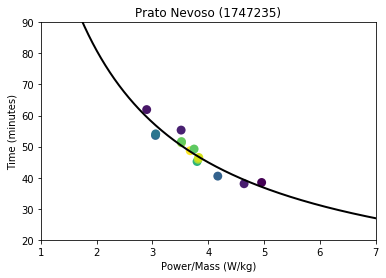
Prato Nevoso offers a fairly straightforward and consistent 8%, which ever so slightly favors pure climbers over the big guys. My guess is this day will go to whoever is feeling freshest. This climb doesn’t have a lot of rides on Strava, but enough to do get some level of estimates.
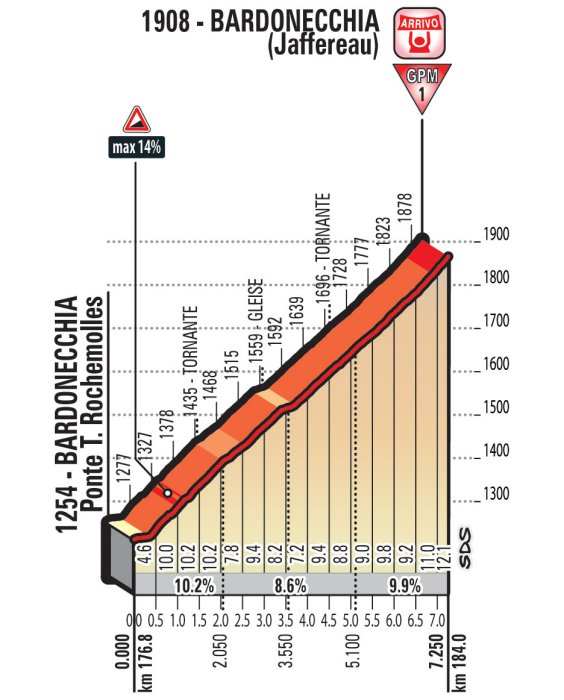
Stage 19: Monte Jafferau
Strava segment: 6.7 km, 9% average gradient, 610 m elevation gain
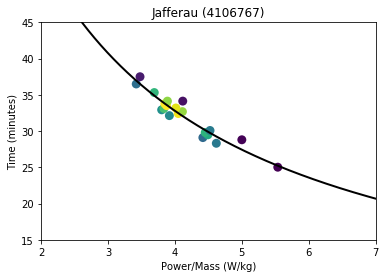
Slightly shorter but steeper than the Prato Nevoso of stage 18, expect to see lots of attacks as riders will be desperate to make up lost time. Like the Prato, this climb also doesn’t have many efforts with power meters on Strava, but we do have enough to get an estimate.
Stage 20: Cervinia
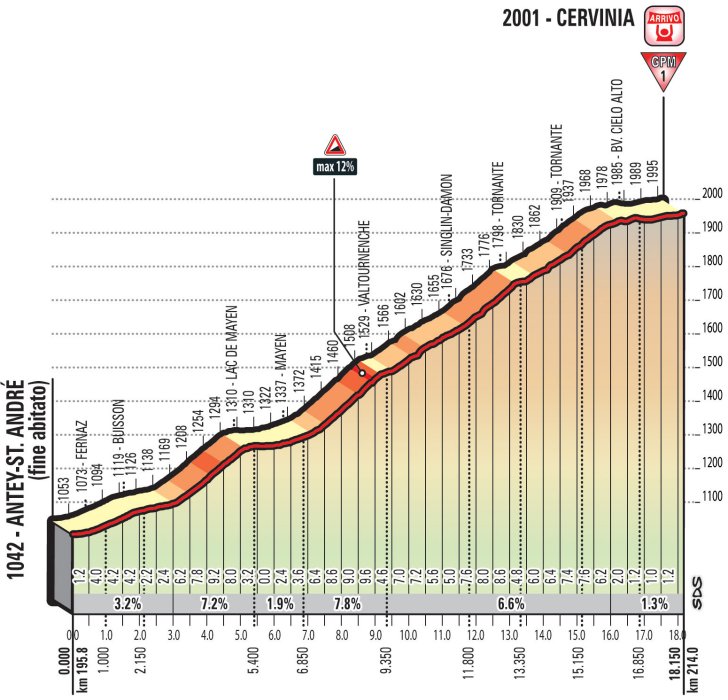
Strava segment: 17.8 km, 5% average gradient, 958 m elevation gain
This climb doesn’t appear to be all that taxing in itself, but it comes right after the brutal San Pantaleon climb, at the end of 3 heavy days of climbing, and of course, the last day of the overall for the contenders. Anything can happen, perhaps attacks fly on the earlier climbs and the race is broken into pieces before this final climb, or perhaps everyone stays together and folks clamor to gain minor placings. If their is still a competition for the overall title, I’d expect the winning move to come on the San Panteleon with the maglia rosa bleeding time on the Cervinia.
That’s it for today! Check back in after each of these stages for more comments and analysis.